Resultados Electorales
Andaluzas 2015
El resultado de las elecciones al Parlamento Andaluz celebradas el día 22 de marzo de 2015 son los siguientes:
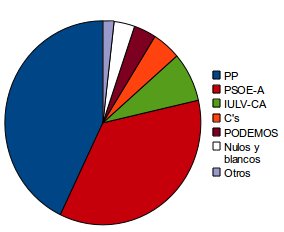
| VOTOS | |
|---|---|
| PP | 466 |
| PSOE-A | 388 |
| IULV-CA | 85 |
| C’s | 51 |
| PODEMOS | 40 |
| Nulos y blancos | 37 |
| Otros | 20 |

Por mesas:
Distrito censal – 01
Sección – 001
Mesa – U
Electores censados que han votado – 523
Interventores no censados en la mesa que han votado – 1
Total votantes – 524
| Votos Nulos | 16 |
| Votos en blanco | 1 |
| Partido Socialista Obrero Español de Andalucía (PSOE-A) | 187 |
| Ciudadanos – Partido de la Ciudadanía (C’s) | 23 |
| Partido Popular (PP) | 246 |
| Unión Progreso y Democracia (IPyD) | 2 |
| Partido Andalucista (PA) | 1 |
| Podemos (PODEMOS) | 17 |
| Partido Comunista de los Pueblos de España (PCPE) | 0 |
| Por un mundo más justo (PUM+J) | 0 |
| Partido Animalista contra el maltrato animal (PACMA) | 1 |
| Izquierda Unida Los Verdes – Convocatoria por Andalucía (IULV_CA) | 28 |
| VOX (VOX) | 2 |
| Partido del Trabajo y la Justicia (PTJ) | 0 |
| Agrupación de electores Recortes Cero Córdoba (RECORTES CERO CORDOBA) | 0 |
| Falange Española de las JONS (FE de las JONS) | 0 |
| Escaños en Blanco (EB) | 0 |
Distrito censal – 01
Sección – 002
Mesa – U
Electores censados que han votado – 563
Interventores no censados en la mesa que han votado – 0
Total votantes – 563
| Votos Nulos | 14 |
| Votos en blanco | 6 |
| Partido Socialista Obrero Español de Andalucía (PSOE-A) | 201 |
| Ciudadanos – Partido de la Ciudadanía (C’s) | 28 |
| Partido Popular (PP) | 220 |
| Unión Progreso y Democracia (IPyD) | 4 |
| Partido Andalucista (PA) | 3 |
| Podemos (PODEMOS) | 23 |
| Partido Comunista de los Pueblos de España (PCPE) | 2 |
| Por un mundo más justo (PUM+J) | 0 |
| Partido Animalista contra el maltrato animal (PACMA) | 0 |
| Izquierda Unida Los Verdes – Convocatoria por Andalucía (IULV_CA) | 57 |
| VOX (VOX) | 2 |
| Partido del Trabajo y la Justicia (PTJ) | 1 |
| Agrupación de electores Recortes Cero Córdoba (RECORTES CERO CORDOBA) | 1 |
| Falange Española de las JONS (FE de las JONS) | 1 |
| Escaños en Blanco (EB) | 0 |
Locales 2015
| GRUPO | MESA1 | MESA2 | TOTAL |
|---|---|---|---|
| PP | 321 | 321 | 642 |
| PSOE | 188 | 184 | 372 |
| AÑORA UNIDA (IU) | 63 | 84 | 147 |
| NULOS | 16 | 25 | 41 |
| BLANCOS | 6 | 5 | 11 |
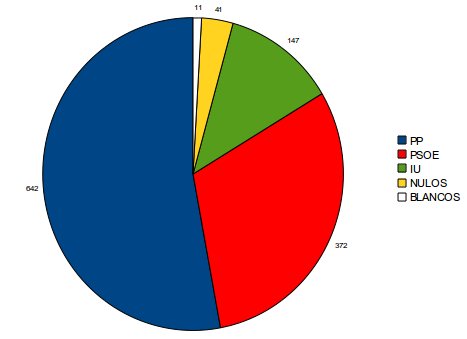
TOTAL VOTANTES: 1340
TOTAL VOTOS: 1213
% PARTICIPACIÓN: 90,52 %
Municipales 2011
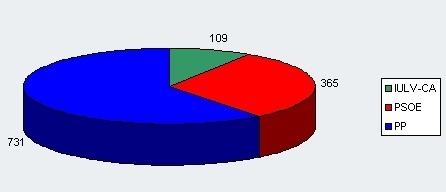
El resultado de las Elecciones Municipales en Añora celebradas el día 22 de mayo de 2011 son los siguientes:
| PARTIDO | SEC1 | SEC2 | TOTAL | CONCEJ. |
| IZQUIERDA UNIDA LOS VERDES – CONVOCATORIA POR ANDALUCÍA (IULV-CA) | 36 | 73 | 109 | 0 |
| PARTIDO SOCIALISTA OBRERO ESPAÑOL DE ANDALUCÍA (PSOE de Andalucía) | 181 | 184 | 365 | 3 |
| PARTIDO POPULAR (PP) | 381 | 350 | 731 | 6 |
| VOTOS NULOS | 6 | 5 | 11 | |
| VOTOS EN BLANCO | 5 | 4 | 9 | |
| TOTALES | 609 | 616 | 1225 | |
| PARTICIPACIÓN | 92.38% |
Europeas 2009
A continuación se muestran los resultados de las Elecciones Europeas 2009 en Añora.
| SIGLAS | MESA 1 | MESA 2 | TOTAL |
| PARTIDO ANDALUCISTA – COALICIÓN POR EUROPA | 2 | 3 | 5 |
| PARTIDO SOCIALISTA DE ANDALUCÍA | 3 | 1 | 4 |
| IZQUIERDA ANTICAPITALISTA – REVOLTA GLOBAL | 0 | 1 | 1 |
| LOS VERDES – EUROPA DE LOS PUEBLOS – VERDES | 1 | 0 | 1 |
| PARTIDO POPULAR | 239 | 234 | 473 |
| CENTRO DEMOCRÁTICO LIBERAL | 1 | 0 | 1 |
| UNIÓN, PROGRESO Y DEMOCRACIA | 6 | 3 | 9 |
| IZQUIERDA UNIDA LOS VERDES – CA | 9 | 31 | 40 |
| LIBERTAS – CIUDADANOS DE ESPAÑA | 0 | 1 | 1 |
| LOS VERDES – GRUPO VERDE EUROPEO | 1 | 0 | 1 |
| PARTIDO SOCIALISTA OBRERO ESPAÑOL | 187 | 218 | 405 |
| MOVIMIENTO SOCIAL REPUBLICANO | 0 | 1 | 1 |
| PARTIDO OBRERO SOCIALISTA INTERNACIONALISTA | 0 | 1 | 1 |
| VOTOS NULOS | 2 | 5 | 7 |
| VOTOS EN BLANCO | 5 | 3 | 8 |
| TOTAL VOTANTES POR MESA | 456 | 502 | 958 |
Congreso 2008
A continuación se muestran los resultados de las Elecciones 2008 al Congreso en Añora.
| CENSADOS | VOTANTES | VOTO | ABSTENCIÓN | |
| MESA 1 | 643 | 585 | 90,98 % | 9,02 % |
| MESA 2 | 663 | 611 | 92,16 % | 7,84 % |
| TOTAL | 1306 | 1196 | 91,58 % | 8,42 % |
| SIGLAS | MESA 1 | MESA 2 | TOTAL |
| ALTERNATIVA ESPAÑOLA (AES) | 0 | 1 | 0 |
| PARTIDO POPULAR (PP) | 292 | 283 | 575 |
| PARTIDO SOCIALISTA OBRERO ESPAÑOL (PSOE) | 254 | 272 | 526 |
| CIUDADANOS – PARTIDO DE LA CIUDADANÍA (C's) | 0 | 1 | 1 |
| IZQUIERDA UNIDA LOS VERDES CONV. POR ANDALUCÍA-ALT. (IULV-CA) | 25 | 41 | 66 |
| PARTIDO SOCIAL DEMÓCRATA (PSD) | 0 | 1 | 1 |
| UNIÓN PROGRESO Y DEMOCRACIA (UPyD) | 0 | 1 | 1 |
| COALICIÓN ANDALUCISTA (CA) | 2 | 2 | 4 |
| NULAS | 7 | 4 | 11 |
| EN BLANCO | 5 | 5 | 10 |
| TOTAL | 585 | 611 | 1196 |
Senado 2008
A continuación se muestran los resultados de las Elecciones 2008 al Congreso en Añora.
| CENSADOS | VOTANTES | VOTO | ABSTENCIÓN | |
| MESA 1 | 643 | 585 | 90,98 % | 9,02 % |
| MESA 2 | 663 | 611 | 92,16 % | 7,84 % |
| TOTAL | 1306 | 1196 | 91,58 % | 8,42 % |
| SIGLAS | MESA 1 | MESA 2 | TOTAL |
| ALTERNATIVA ESPAÑOLA (AES) | 0 | 1 | 0 |
| PARTIDO POPULAR (PP) | 292 | 283 | 575 |
| PARTIDO SOCIALISTA OBRERO ESPAÑOL (PSOE) | 254 | 272 | 526 |
| CIUDADANOS – PARTIDO DE LA CIUDADANÍA (C's) | 0 | 1 | 1 |
| IZQUIERDA UNIDA LOS VERDES CONV. POR ANDALUCÍA-ALT. (IULV-CA) | 25 | 41 | 66 |
| PARTIDO SOCIAL DEMÓCRATA (PSD) | 0 | 1 | 1 |
| UNIÓN PROGRESO Y DEMOCRACIA (UPyD) | 0 | 1 | 1 |
| COALICIÓN ANDALUCISTA (CA) | 2 | 2 | 4 |
| NULAS | 7 | 4 | 11 |
| EN BLANCO | 5 | 5 | 10 |
| TOTAL | 585 | 611 | 1196 |
Parlamento Andaluz 2008
A continuación se muestran los resultados de las Elecciones 2008 al Parlamento Andaluz en Añora.
| CENSADOS | VOTANTES | VOTO | ABSTENCIÓN | |
| MESA 1 | 643 | 583 | 90,67 % | 9,33 % |
| MESA 2 | 663 | 610 | 92,01 % | 7,99 % |
| TOTAL | 1306 | 1193 | 91,35 % | 8,65 % |
| SIGLAS | MESA 1 | MESA 2 | TOTAL |
| PARTIDO POPULAR (PP) | 308 | 300 | 608 |
| PARTIDO SOCIALISTA OBRERO ESPAÑOL (PSOE) | 235 | 248 | 483 |
| CIUDADANOS – PARTIDO DE LA CIUDADANÍA (C's) | 0 | 1 | 1 |
| IZQUIERDA UNIDA LOS VERDES CONVOC. POR ANDALUCÍA (IULV-CA) | 23 | 43 | 66 |
| UNIÓN PROGRESO Y DEMOCRACIA (UPyD) | 0 | 1 | 1 |
| COALICIÓN ANDALUCISTA (CA) | 4 | 4 | 8 |
| LOS VERDES (VERDES) | 1 | 0 | 1 |
| FALANGE ESPAÑOLA DE LAS JONS (FE de las JONS) | 2 | 0 | 2 |
| NULAS | 5 | 7 | 12 |
| EN BLANCO | 5 | 6 | 11 |
| TOTAL | 583 | 610 | 1193 |
Municipales 2007
A continuación se detallan los resultados de las Elecciones Municipales celebradas en el año 2007.
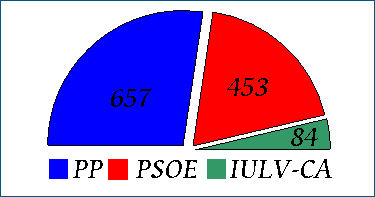
Resultados Elecciones Municipales 2007
- PP: 657
- PSOE-A: 453
- IULV-CA: 84
Referendum Estado Autonomía
Resultado del referéndum sobre la Reforma del Estatuto de Autonomía de Andalucía en Añora:
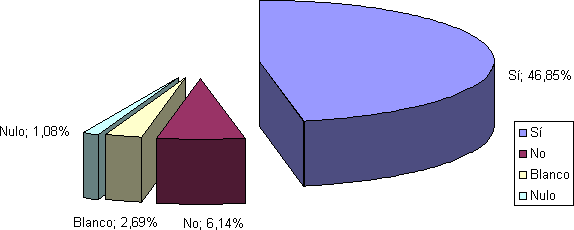
| Número | Porcentaje sobre censados | Porcentaje sobre votantes | |
|---|---|---|---|
| Censados: | 1302 | ||
| Votantes: | 739 | 56,75 % | |
| Sí: | 610 | 46,85 % | 82,54 % |
| No: | 80 | 6,14 % | 10,83 % |
| Blanco: | 35 | 2,69 % | 4,74 % |
| Nulo: | 14 | 1,08 % | 1,89 % |
Congreso 2004
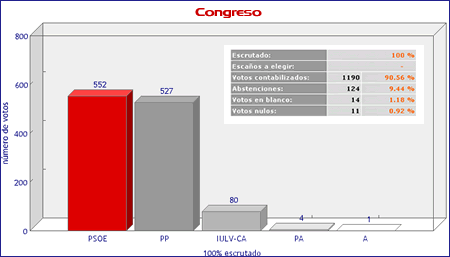
Resultados Congreso
- PSOE: 552
- PP: 527
- IULV-CA:80
- PA:4
- A:1
| Escrutado: | 100% | |
| Escaños a elegir: | – | |
| Votos Contabilizados: | 1190 | 90.56% |
| Abstenciones: | 124 | 9.44% |
| Votos en Blanco: | 14 | 1.18% |
| Votos Nulos: | 11 | 0.92% |
Senado 2004
| SENADOR / PARTIDO | ESCAÑOS | VOTOS |
| Maria Isabel Antonia Flores Fernandez (PSOE) | 551 | 46.97 % |
| Luis Moreno Castro (PSOE) | 548 | 46.72 % |
| Pedro Rodriguez Cantero (PSOE) | 546 | 46.55 % |
| Angel Blanco Moreno (PP) | 526 | 44.84 % |
| Eva María Ostos Morneo (PP) | 519 | 44.25 % |
| Florencio Luque Aguilar (PP) | 518 | 44.16 % |
| Francisco Javier Altamirano Sanchez (IULV-CA) | 76 | 6.48 % |
| Isabel Amil Castillo (IULV-CA) | 73 | 6.22 % |
| Rafael Muñoz Ramirez (IULV-CA) | 72 | 6.14 % |
| Juan Garrido Clavero (PA) | 4 | 0.34 % |
| Emilio Pedrosa Ruíz (CAC) | 3 | 0.26 % |
| Miguel Angel Bodas Espejel (PADE) | 2 | 0.17 % |
| Antonio García Soto (FE de las JONS) | 1 | 0.09 % |
| Esther González Bravo (OtraDem) | 1 | 0.09 % |
| Fernando MiguelHernandez Cerezo (PH) | 1 | 0.09 % |
| Manuel Maestre Barranco (A) | 1 | 0.09 % |
| Antonio Muro Romero (PA) | 1 | 0.09 % |
| Francisco Peinado Fajardo (PA) | 1 | 0.09 % |
| Escrutado: | 100% | |
| Escaños a elegir: | – | |
| Votos Contabilizados: | 1190 | 90.56% |
| Abstenciones: | 124 | 9.44% |
| Votos en Blanco: | 19 | 1.6% |
| Votos Nulos: | 17 | 1.43% |
Parlamento Andaluz 2004
A continuación se muestran los resultados de las Elecciones 2004 al Parlamento Andaluz de Añora.
| SIGLAS | VOTOS | % |
|---|---|---|
| PSOE-A | 529 | 44.83 |
| PP | 513 | 43.47 |
| IULV-CA | 89 | 7.54 |
| FA | 19 | 1.61 |
| PA | 14 | 1.19 |
| A | 1 | 0.08 |
| NIVA | 1 | 0.08 |
| OtraDem | 1 | 0.08 |
| PSA | 1 | 0.08 |
| FE de la JONS | 0 | 0 |
| PH | 0 | 0 |
Municipales 2003
A continuación se detallan los resultados de las Elecciones Municipales celebradas en el año 2003.
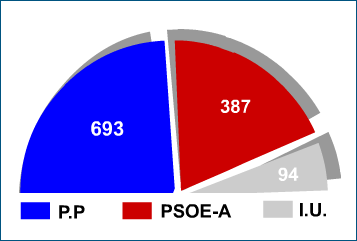
Resultados Elecciones Municipales 2003
- PP: 693
- PSOE-A: 387
- IU: 94
